Mapping the innovation ecosystem helps us navigate the loose network of individuals and organisations focused on helping innovative startups and entrepreneurs build, grow, and scale their business. A map creates a shared understanding and a basis for measuring to provide for better decisions.
I outlined different approaches to mapping in my previous post. capturing great work being done in mapping the Australian Ecosystem at the local level, including the Blue Chilli Startrail project, the City of Geelong Geemap, Adelaide’s ecosystem map, the Startup ecosystem canvas, the UNSW Startrail, and the Sunshine Coast ecosystem map. These provide fantastic localised representations, and have contributed to a broader Australian understanding.
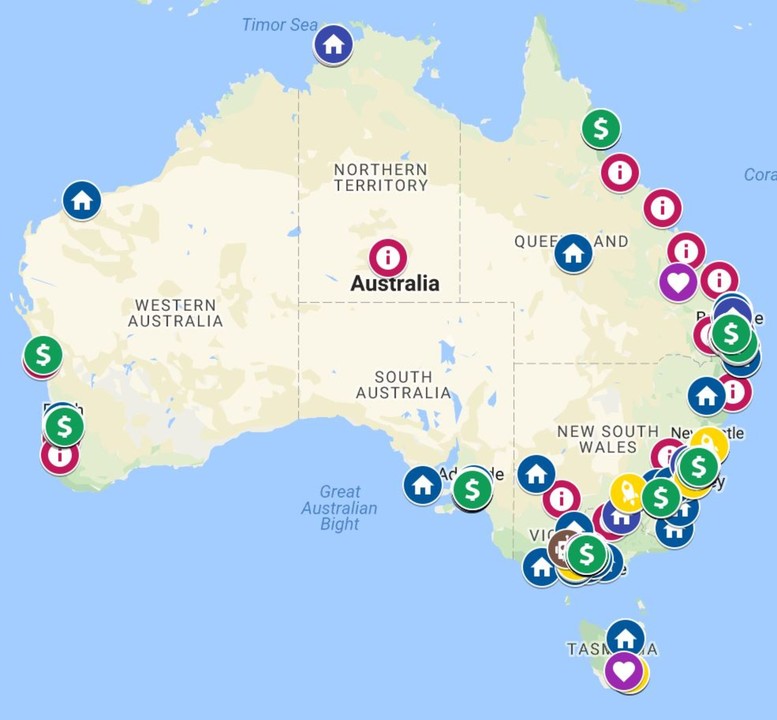
With this in mind, and as part of an overall measurement project, I present a collection of ecosystem actors on a Google Map as an initial reference point.
Other mapping projects including the Startup Muster report and the StartupAus Crossroads update will shed more insights into the state of the ecosystem. The Airtree spreadsheet is an incredible resource and used by many as a point of reference. Others to note at the national level are Taylor Tran doing good work documenting the state of coworking in Australia, Angela Bee Chan supporting with Hackathons Australia, and Dianna Sommerville leading regional innovation through the Australia Post Regional Pitchfest. The Hackerspace Wiki is also a good source for hackerspaces, and state level representations include the StartupQld MapMe project.
The map is an ongoing work in progress, updated as new actors are identified and categorisations clarified. The graphs at the bottom of the post will be updated weekly. A more dynamic system is currently in progress, planned released end of 2017.
The link to the Google Map is here.
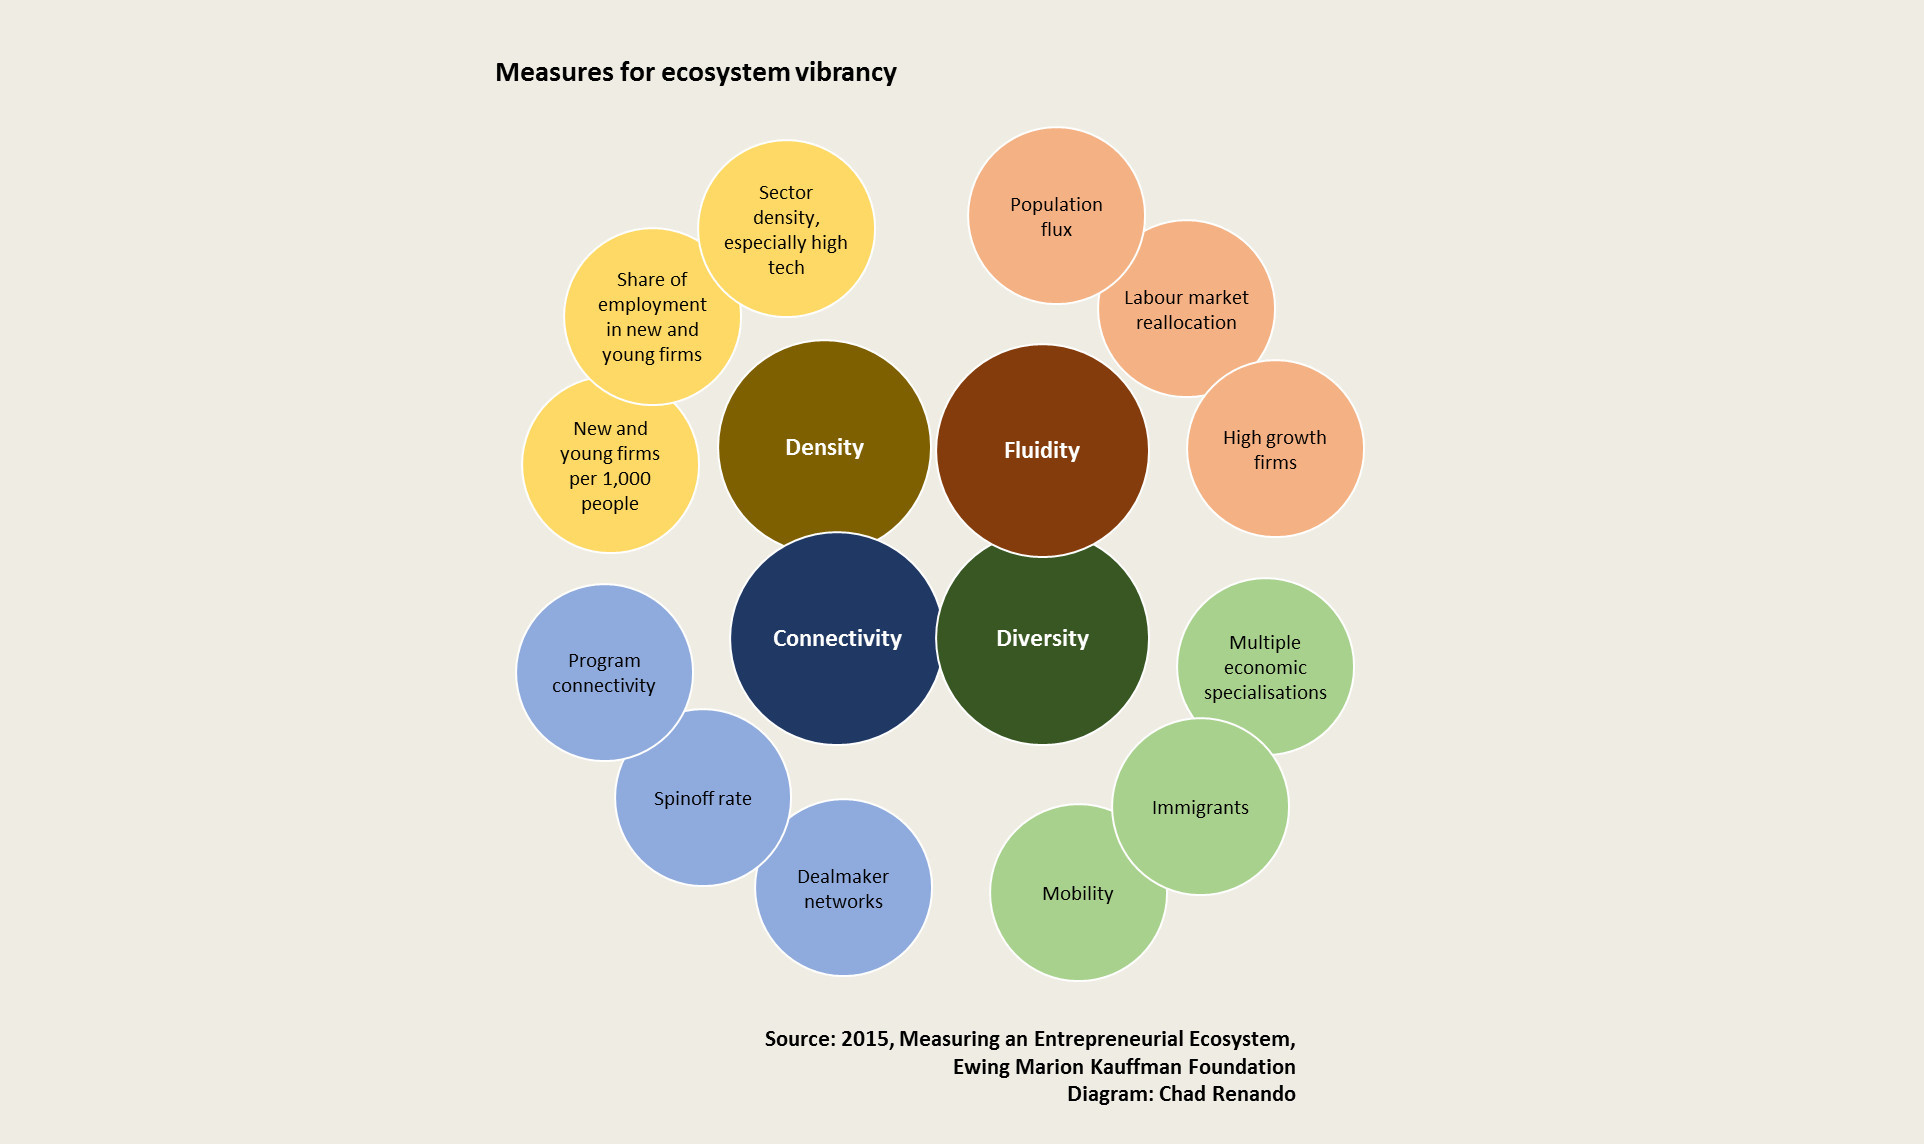
Diversity and density in the Australian Innovation Ecosystem
A quick note overall on the Australian innovation ecosystem, which is unique in terms of diversity and density.
The nation’s relatively small population is spread across a large land mass and focused in a handful of capital cities. Density and access to diversity and specialist skills can be a challenge, limiting serendipitous collisions and introduction of new ways of thinking critical to innovation activity. The continent’s natural borders create barriers to inhibit natural migration of startup activity and external knowledge.
These barriers are being overcome, such as with programs like Startup Catalyst‘s trips into overseas innovation markets, conferences such as Startcon and Myriad that bring in international speakers and investors, Advance Queensland’s HotDesQ program that incentivises international startups to bring skills and innovation into the country.
In addition to these structured programs, connectivity in the ecosystem is made possible by mentors, successful business people and advisors who travel the regions, take clients overseas, opening up international networks, and volunteer to make hackathons and accelerator programs possible. A good example of this can be seen with Mark Phillips and Linda McCall, digital nomads in Queensland on a perpetual road trip to give back to the regional innovation ecosystem.
The Australian innovation ecosystem can be seen as a whole, and also as being made up of individual ecosystems in each state, metro city center, and regional area. Each has unique attributes of the local area and cultural influence at the national level. Sydney, Melbourne, Adelaide, and Brisbane ecosystem are as distinct as those in Boulder, Colorado or Silicon Valley, while all share attributes of Australian startup culture as distinct from that found in the US or Europe.
Considerations
This map is incomplete. I post it here for feedback and in the interest of shipping before perfection. Some additional caveats:
- Accuracy and completeness: Some things were missed, some I expect embarrassingly obvious. Please comment below and they can be added.
- This is a start: A more updateable and user friendly system is in development. The work is a constant balance of wanting the results to be perfect and getting the work out for feedback. Feedback wins, enjoy the map.
- This is an interpretation: The categorisation and classification is an assessment after visiting every website and many hours looking at other great lists like Airtree Venture’s spreadsheet, Simone Eyles’s map of regional and rural coworking spaces, and google searches. Other perspectives are welcome.
- Currency: The ecosystem is dynamic and new actors are entering and exiting regularly.
- Multiple representations: The categorisation means that an accelerator program may also be a coworking space and an investment group. A space offering a program and an investment fund will support all the activities simultaneously in a region, so each is listed separately for the region in which they operate.
- Location-based representation: Organisations with multiple offices are mapped per office, as it reflects local availability to the ecosystem. Some programs are national or virtual, and it can be difficult and perhaps not useful to identify a single location. But geography is the unit of measure for a physical map. Where no location was listed, I pulled the base of operations from the privacy policy or an ABN lookup. Where an organisation did not have an address, it is stacked in the city centre. This results in several organisations stacked on each other in one location.
Categorisation
Space: Coworking spaces, Innovation hubs, Makerspaces / Hackerspaces / Artspace
Coworking spaces provide opportunities for startups to work efficiently, create serendipitous collisions, and build community with like-minded individuals who can assist growth. The diversity of needs in a community result in a range of types of spaces.
Tim Mahlberg co-authored a great report on coworking spaces that outlines seven archetypes of coworking: Creative collective, Social studio, Digital den, Urbpreneur pad, Townhall terminal, Corporate community, and Executive establishment. These are based on seven dimensions: Location, space concept, coworking focus, ownership, industry focus, member type, and openness to new members.
I did not get as granular, opting for three categories: Coworking space, Innovation hub, and Hackerspace / makerspace / artspace. This distinction is made based on the extent that the space had evidence of programs or infrastructure to support being an innovation hub or hackerspace.
An innovation hub requires additional resources for programs, which necessitates additional revenue streams and different business models. More innovation hubs in a region could be considered reflective of future entrepreneurial activity.
Hackerspace /makerspace / artspace locations focus on the ideation and creation stage, and some offer coworking. These are critical to the ecosystem to develop ideas and talent. Emerging artspaces provide specialist infrastructure around creative industries without necessarily being supported by structured programming. The hackerspaces is one area I know is under-represented on the map.
Accelerator / Incubator programs
Accelerator or incubator programs can be short-term or ongoing, but are generally cohort-based with a start and stop date. Accelerator or incubator programs can run virtually, but are often based out of a dedicated space. Virtual or distributed programs are mapped at best guess where the program headquarters are based.
Programs can be the most dynamic to map, with many programs being short-term for a single cohort. The majority of programs mapped are ongoing.
Investment
Investment groups connect investors to startups and manage funds focused on entrepreneurial activity. To be considered, the group had to reflect a focus on early-stage investments.
Connection programs and groups
Connection programs and groups act as boundary spanners and glue for the innovation ecosystem, facilitating connections, introductions, advocacy, and support. These generally have a focus on geography (Australia, state or local government, regional or rural), technology or sector (agriculture, bitcoin, Fintech), or demographic (gender). National groups are mapped based on the location of the headquarters, where known.
Data cut
I am cautious to make too many observations acknowledging caveats about completeness and categorisation. I expect a few rounds of feedback to change categorisation and add actors.
The Queensland government’s Advance Queensland initiative’s support for regional innovation activity combined with activation by the Office of the Queensland Chief Entreprenur is having an impact on the number of regional spaces delivering dedicated innovation programs. This is expected to have a direct impact on future entrepreneurial outcomes including number of startups and employment in new sectors.
Higher population density plays a large part in the number of ecosystem actors. I expect more coworking spaces in Victoria and New South Wales to nominate as innovation hubs. New South Wales has a significant investment representation and a strong FinTech focus.
The map is beta as additional systems are developed. Your comments, corrections, and feedback are welcome.