It has been a year almost to the day since we released the digital map of support for Australian entrepreneurs. As we head into a New Year and a new decade, we pause to reflect on the year that was, what the data shows, and what lies ahead for entrepreneur support in Australia.
The mapping process
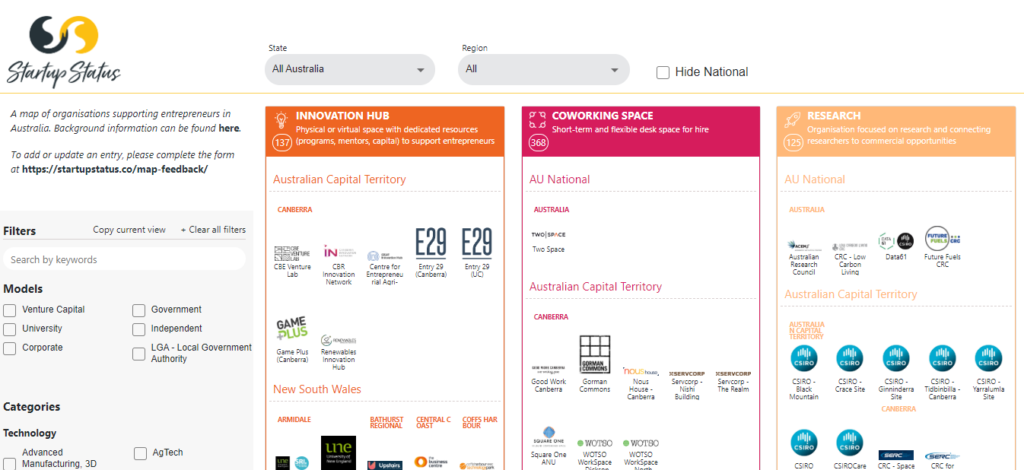
We released the map of support for Australian entrepreneurs in 2018 and continue to update it on a regular basis, adding around 50 new entries a week. The purpose of the map is to provide a curated up-to-date visual resource of entrepreneur support in Australia. You can read the initial release post which outlines the details and history of the project.
After a year of data mining, we pause for some reflections on the process itself:
“Everything must be made as simple as possible. But not simpler.” ― Albert Einstein
- Documenting the national innovation system. Startup Status is part of a growing discipline in Australia and globally dedicated to systems thinking – a formal and abstract process focused on the value and topography of the system itself. A coordinated national focus on innovation is a relatively recent endeavour, captured in part through the Australian federal government’s 10-year project assessing the Australian innovation system. StartupAus has a six-year track record assessing startup support with their Crossroads report. Others platforms such as Techboard, Decode Systems, RamenLife / TechSydney, and LaunchVic’s Laneways have emerged in recent years to provide data on startups, localised support systems, and specific functions such as investment. Survey platforms that compare Australia against global economies include Startup Genome and the Global Entrepreneurship Monitor. There are also university bodies such as QUT’s Australian Centre for Entrepreneur Research (ACER), USQ’s Rural Economies Centre of Excellence (RECOE), and the University of Adelaide’s Entrepreneurship Commercialisation and Innovation Centre (ECIC) that focus on system-level research, and an annual national conferences focusing on entrepreneur research at the Australian Centre for Entrepreneur Research Exchange conference. At Startup Status we aim to contribute to this discussion, supporting those who focus on detailed mapping of roles, actors, and functions in each region across Australia over time. As we grow and collaborate with others, we continue to focus on the quality of roles in each region, the network strength between actors, and boundaries around different “ecosystems” (eg., by region, technology, industry sector, population demographic, etc.).
- Mapping is informed and subjective. The map is informed by research and accepted models and institutions such as the OECD, REDI, MIT, NESTA, the Aspen Institute, and the Kauffman Foundation. However, categorisation still requires a degree of personal judgement. Many roles perform similar functions as other roles, but there will be functions that make a role unique.
- A work in progress. A year in and the map is far from exhaustive and will never be complete. Data for roles highlighted in yellow in the table below are more comprehensive and there is greater certainty that it reflects the total population. For example, there is a finite and known number of universities and accelerator programs. Other roles, such as coworking and investment, are a bit more transient. Cafes and libraries expand into shared desk space and investment groups change focus in their support for higher risk entrepreneurs over traditional investment. Still other roles such as education and support can be a catch-all. There can be delays when an accelerator opens or closes and when it is recorded on the map, and it is not always clear if an accelerator is on pause awaiting funding or no longer in operation.
- The manual process of curation. The majority of the data in the system is manually curated and captured. Different approaches to data collection include: surveys, APIs into other systems, scraping, building end-customer functionality, and manual data mining. All of these of these are built into the Startup Status platform and each has varying levels of security, privacy, legality, data quality, efficiency, maintenance, and cost to consider. There are over 1,600 actors in roles across 2,000 locations in Australia in the system. This is in addition to over 9,000 organisations who are in the system as program participants and hub members. Performing an audit or adding one data point to just the hubs, assuming 5 minutes per review, is 20-days worth of effort. We automate where possible but manual curation is still required.
- Towards an integrated approach. There are a few dozen platforms in the market that perform mapping and measurement functions. A detailed review of these will be provided in the future – a map of the ‘ecosystem’ of ecosystem mapping tools. The complexity and scale of the challenge means that no single platform can “own” the ecosystem map. Integration and collaboration is critical, and we all play our part.
- Definitions and defining the boundaries. There is definition work in progress on the concepts such as “innovation”, “entrepreneur”, “startup”, and “ecosystem”. Our focus is on what is known as “innovation driven entrepreneurship”. This remains broad but still has enough of a focus to draw a loose scope around who to include in a map.
- Navigating the map. The map has gone from a few hundred actors in PowerPoint to close to 2,000 actors in a digital platform. We continue to develop automation, different approaches to navigation, and integration with other platforms to ensure value into the future. As the data grows, we will develop new collaborative partnerships and new interfaces to provide value to Australian entrepreneurs and those who support them.
Reflections from the 2019 mapping data
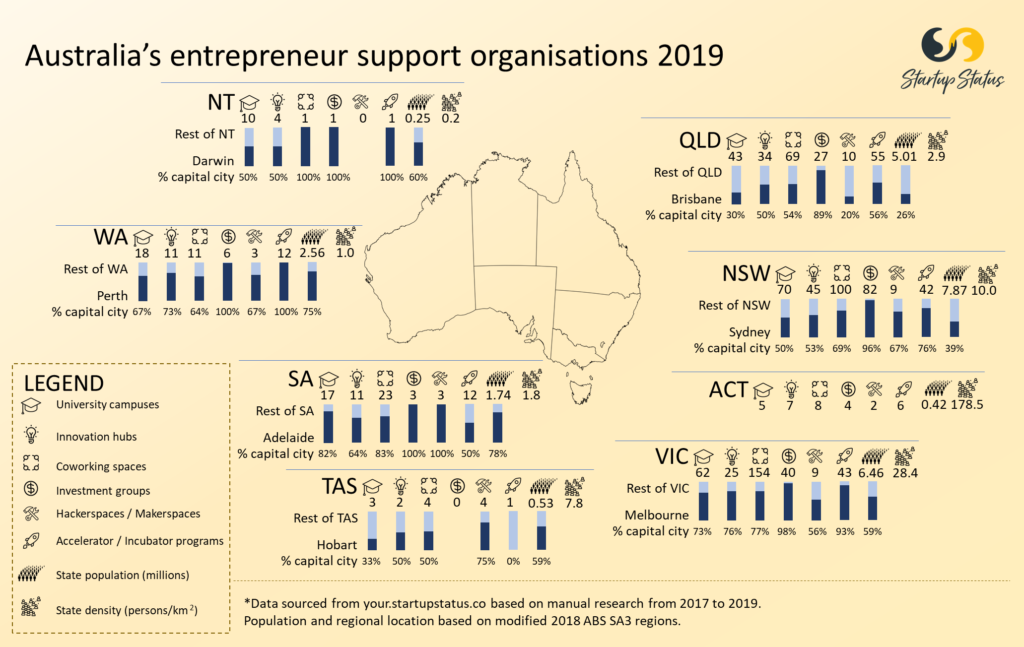
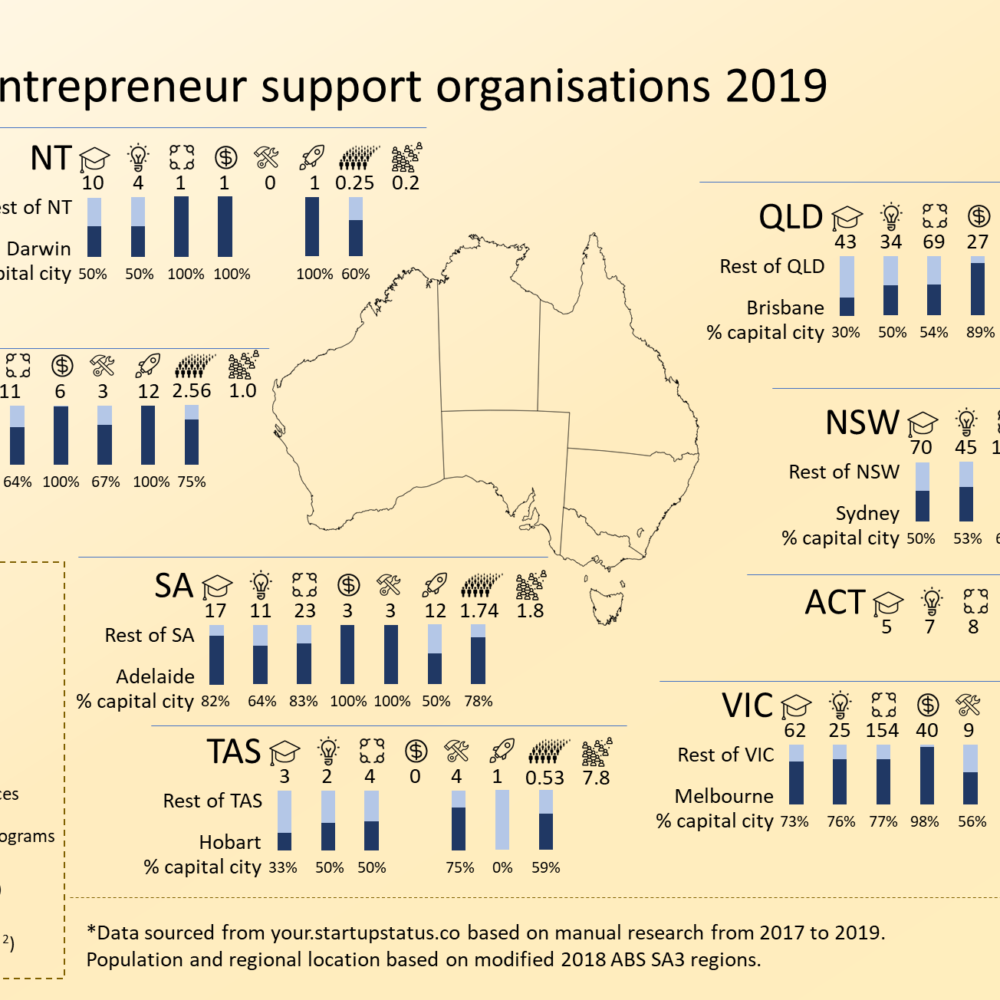
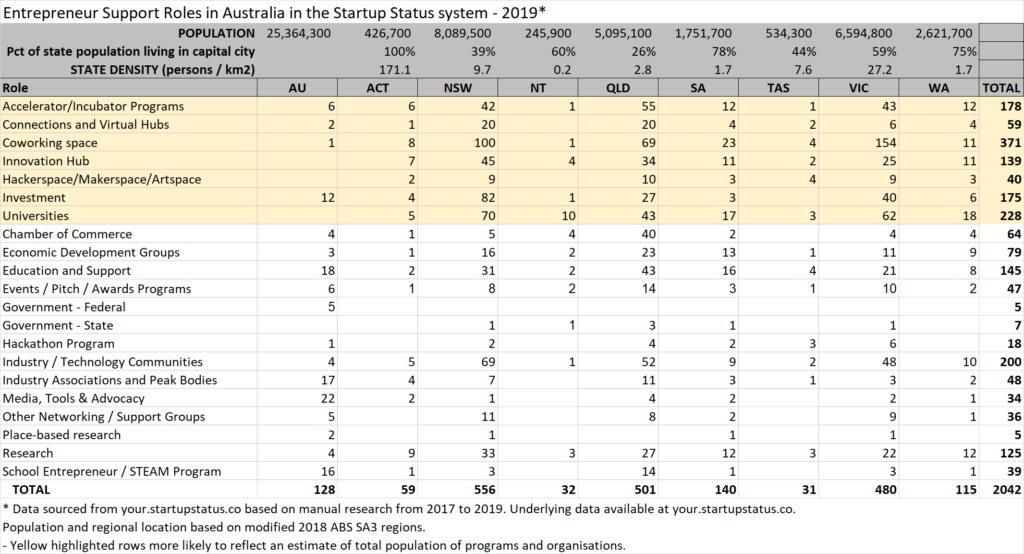
The graphic above and table below shows numbers of actors who provide dedicated entrepreneur support services and have physical representation in Australia. A few points to keep in mind:
Data focus: The data represents what is in the Startup Status platform and is not an exhaustive report on all actors in the system. Data such as Chambers of Commerce are obviously not yet nationally documented, and there are a significant number of Other Support Networking Groups or Awards programs that need to be added to those in the map. Roles highlighted in yellow in the table are more likely to be accurate.
Not for ranking: We caution against ranking regions against each other based on numbers. Approaches that focus predominantly on rankings without explaining the underlying algorithms create issues when people rely on vanity metrics for media statements. The IMD and OECD rankings have some rigour behind their comparisons. Also, relying on number of actors is an issue, as more is not always better. One quality accelerator can result in better outcomes than 5 low-quality programs. Alternatively, a region may be focusing on early-stage support with greater numbers versus more intensive individual later-stage programs. Both may be effective depending on the lifecycle of the local ecosystem.
Local context (density) matters: Density and population distribution are also included as they play a critical factor. New South Wales and Victoria have higher densities and representation in their capital cities. Northern Territory has two primary centres of Darwin and Alice Springs, and the spaces they do have have dedicated entrepreneur support programs rather than a general coworking approach. Queensland has significant population distribution and regional representation. ACT is unique as the nation’s capital. Perth and South Australia have large areas with over 70% of the population living near the capital regions. Tasmania has some representation of each actor but would leverage neighboring states for resources such as investment capital. Each state is unique and competes for scarce resources with the configuration and assets they have available.
Multiple counts: Each number represents an actor that is acting in a role in a region. One organisation can act as multiple actors, such as when a local government runs an innovation hub and delivers an acceleration program.
National vs. state listing: Apart from local delivery of physical assets such as coworking spaces or localised programs such as hackathons, the determination to allocate an actor to a location is not always straightforward. An investment company based in Sydney is national and global by nature. An accelerator program would draw applicants from around the country and some do not require on-site participation. Allocating an actor to a location does not mean they do not service national. That said, location and density matters, as shown by the high concentration of investment organisations in Sydney. There are a few instances where the organisation has a virtual presence for a national service and these are allocated to AU overall.
Innovation hub vs. coworking space: Of all the classifications, the determination between a coworking space and innovation hub can be most subjective. The determination is based on evidence of dedicated resources and documented strategies by the organisation towards supporting innovation-driven entrepreneurs beyond acting as a venue for innovation-related events. Example of this distinction is WeWork as a coworking space and WeWork Labs as the innovation hub element, or a regional coworking space that trains the community manager as a Startup OnRamp facilitator. Also to note that innovation hubs always act as coworking. There are also virtual connection programs which are listed under “Connection and Virtual Hubs”, and online-only programs which are listed as “Education and Support”.
Population estimates: The Australian Bureau of Statistics (ABS) provides populations based on different levels of detail. They also provide populations based on what are known as Greater City Centre Statistical Area (GCCSA). In defining populations based on what is and is not in a city centre, we modified what was included in the GCCSA based on distance from the city centre. The reason for this is based on an observation of human behaviour around travel and identity with region.
Feedback: Finally, this is a manual pull of data. The data will change as soon as the feedback rolls in. New actors have also likely been added from the time we hit publish to the time you are reading this post. Your feedback will contribute towards a more dynamic version based on where there is value.
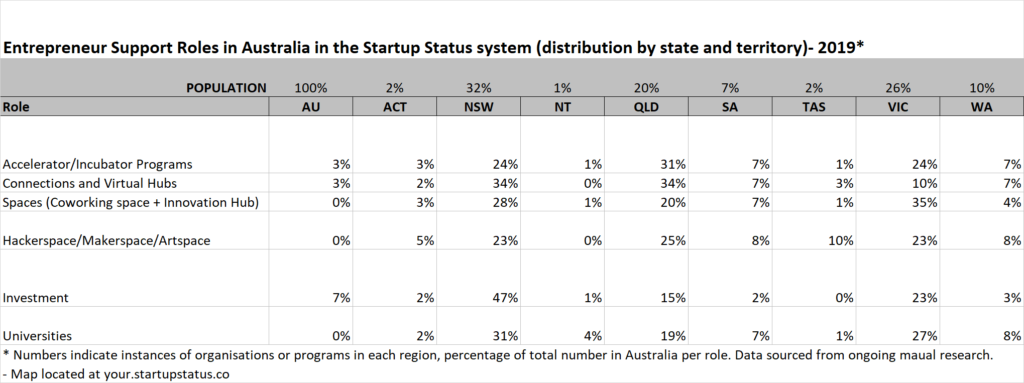
When looking at the data, it can help to examine where the quantity of actors varies from a region’s representation of the national population, which we analyse below:
Queensland shows a higher percentage of actors to population in areas of innovation hubs and virtual hubs. Acknowledging the subjective nature of distinguishing a coworking space from an innovation hub, this may bean influence of different state funding policies. The Advance Queensland program directly funded innovation activity which increased the number of actors. Examples include: the Startup OnRamp program funded to be rolled out across Queensland in 2018; the Advancing Regional Innovation Program, which created additional connection groups to administer the program such as SCRIPT on the Sunshine Coast and Ignite FNQ in the north; the HotDesQ program which mandated that entrepreneurs reside in regional areas; and the Regional Startup Hubs Support Program funding direct to innovation hubs.
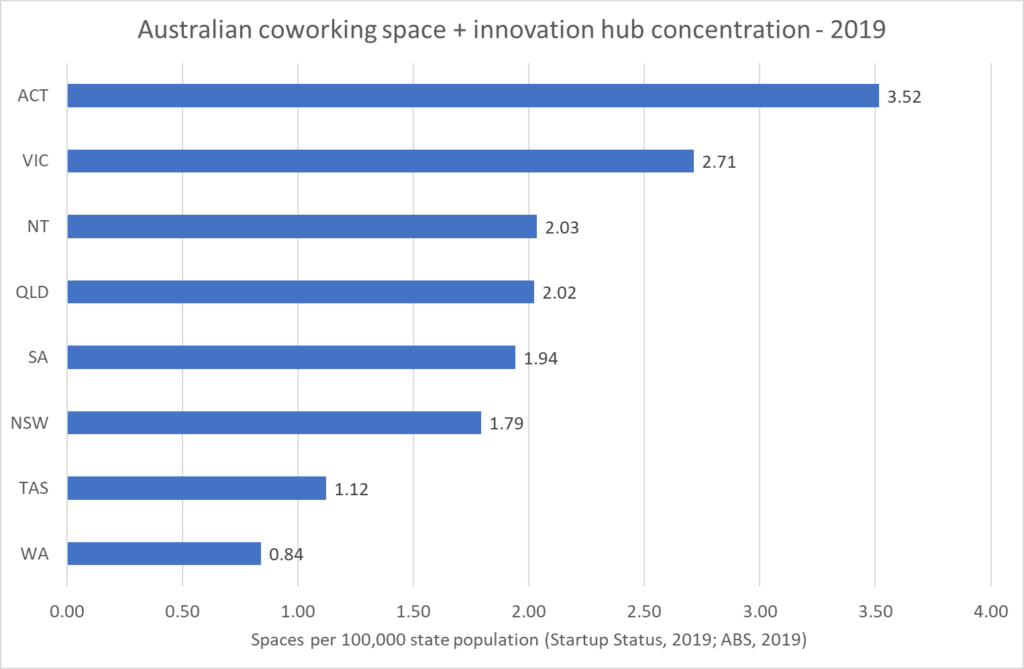
Victoria has a lot of spaces. With a combined 179 coworking spaces and innovation hubs, there are 2.71 spaces per 100,000 people in Victoria. Over 3/4 of these (138) are in the greater Melbourne region, meaning Melbourne city has over 3.5 spaces per 100,000 people. Other data to explore in the future is model of hubs (majority independent), date of creation, and business culture factors to help explain the significance.
New South Wales is headquarters to almost half the identified investment organisations. Sydney has been identified as a leader in FinTech, and Sydney-based Stone and Chalk was the first financially-focused hubs in Australia.
Investment is centered in the capital cities. It makes sense that capital is centered around density and potential deal flow. While there are a number of regional angel groups forming (Queensland as an example with 11% of investment groups outside of Brisbane) investment opportunities remain in the capital cities.
Universities are evenly distributed per capita but role in entrepreneur support can vary. There is representation of university campuses across Australia, which would be expected as a foundational role in the innovation support. Where there are differences is the leadership role that the local campus plays in supporting innovation-driven entrepreneurs.
Reflecting on current state and what’s next
My personal view on the Australian entrepreneur support is one that is maturing and in transition. There can be criticism from a perceived softening from the 2015’s Ideas Boom, removal of funding from CSIRO’s OnPrime program, and reviews of corporate support such as telstra’s muru-D and the Blue Chilli accelerator programs. The StartupAus Crossroads report outlines clear policy recommendations, in areas including: tax incentives, employee share scheme incentives, copyright legislation, export market grants, data collection and access, payroll tax, entrepreneur visas, and global innovation ambassadors. Australia sits in position 18 out of 63 countries in the IMD global competitiveness rankings, with challenge areas listed as “Having the know-how to apply technologies that make Australia more competitive.”
And yet there is more support and focus than ever in the Australian ecosystem. Melbourne, Sydney, and Queensland have all participated in the MIT Regional Entrepreneurship Acceleration Program (REAP) to help build their ecosystems. Western Australia, Queensland, New South Wales, and Victoria are maturing their regional investment programs to ensure distribution of opportunity. In line with recommendations from the 2018 Startup Genome report, regions are focusing on core strengths rather than being all things to all people. We are seeing more direct connections with global precincts at the hub level.
The entrepreneur support network is a complex adaptive system. Everything that happens – global rankings, political advocacy, entrepreneur success and failure – is all feedback to which the system responds. The speed of response may be slowed by political cycles and budget reviews, but the system will adapt and learn.
We are seeing the maturing of state precincts such as Sydney’s StartupHub, Queensland’s The Precinct, and South Australia’s latest entry Lot Fourteen. There is continued expansion of multi-site coworking models such as WeWork, Wotso, Hub Australia, and Christie Spaces, along with traditional serviced offices such as Regus, Servcorp, and The Executive Centre. Queensland Little Tokyo Two closed down, Melbourne’s YBF Ventures took operational control of Sydney’s Tyro Fintech Hub, Townsville’s iNQ closed and an innovation centre is opening under a new model, Goulburn’s Workspace2580 is now managed by the local council, and Canberra’s Entry29 has a holding “watch this space” page on their website.
We have the individual parts in Australia to support entrepreneurs. Challenges are cultural and systemic, which is not always reflected in numbers alone. We believe the opportunity is to continue to support the system to work together through better access to quality data, improved collaboration, and greater access to the knowledge and resources for innovation driven entrepreneurship.
As always, feedback is welcome. We look forward to working with local, national, and global leaders who are advancing entrepreneur support.