
How do we measure the impact of our entrepreneur ecosystem?
Those who ask this question are usually seeking responses from a few perspectives. They may be wanting to know what indicators or metrics to use. They may be looking for what method to use or how to represent the results. Often they are wanting to understand what systems, platform, or tools they can use to access, collect, analyse, and community data related to entrepreneur activity.
This report addresses the last point by providing a “map of mapping systems”.
It can seem like a case of the cure being as complex as the challenge. A number of platforms, systems, and surveys have emerged to support mapping, measurement, and analysis of entrepreneur and business activity. The reality is that there are only a handful of approaches to consider when the systems are broken down into categories of function.
There are also valid reasons why to choose one approach or another, and a portfolio approach of multiple systems and methods is likely. Just like a business will use multiple systems to manage and measure its operations, a region will rely on a suite of tools that address different aspects of the ecosystem. The opportunity is to know why certain approaches are used and ensure each is used to the full extent of its ability.
The reason for writing this report is to provide clarity for those making decisions on policy and research relating to entrepreneur ecosystem measurement. Lack of information or confusion about options can lead to inefficiencies and inaction. It is the hope that knowing what options are available and why one option might be used over another will align focus and support collaboration in regions seeking to understand and support entrepreneur activity.
A brief analogy and history of entrepreneur ecosystem measurement
I often think about measurement of entrepreneur ecosystems similar to that of a car dashboard. A century ago the average driver knew very little about the running of a car by simply looking at the car dashboard. To understand the performance and status of the car, we would need to stop driving, look under the hood, manually measure levels and pressures, and perhaps get a specialist mechanic to help.
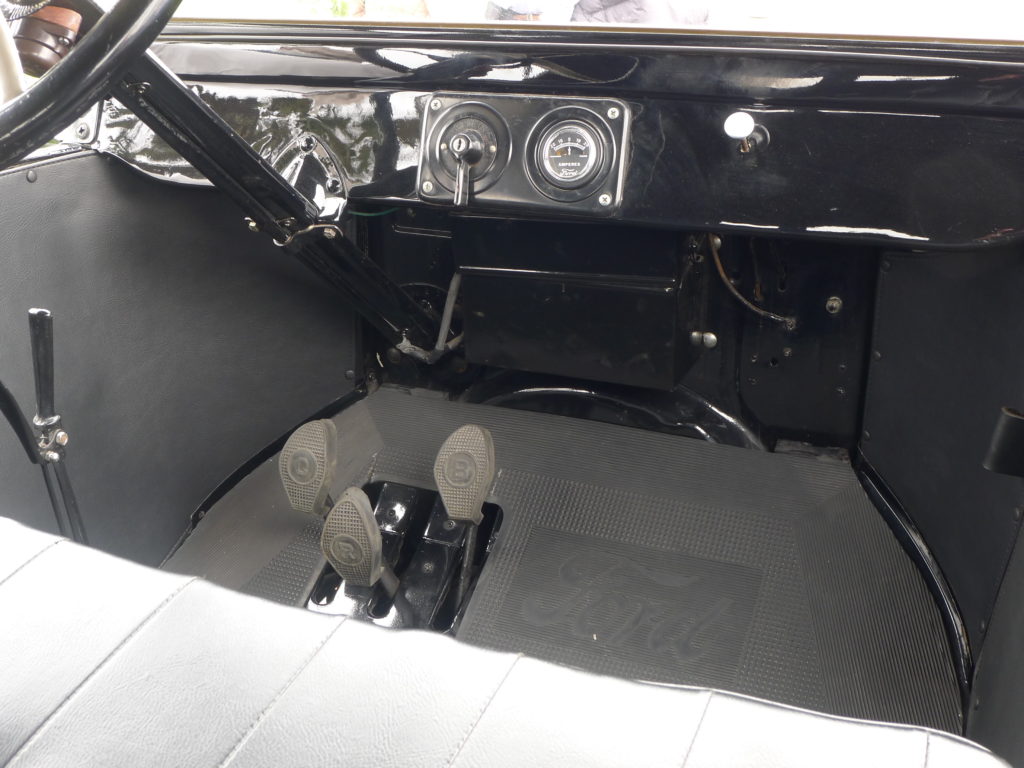
A century later and car dashboards provide everything at our fingertips. Even as cars have become more complicated, we no longer concern ourselves about measuring the performance of the vehicle as we drive. Our focus is exclusively on the experience of the drive and the destination. I predict the same will be said for entrepreneur ecosystems.

Entrepreneur ecosystems are relatively new, emerging as a concept from the late 1980s. It took a decade into the 1990s to understand what they were. Another decade of the 2000s was spent raising awareness and acknowledging there is a need to measure and determining what that measurement might look like. The earliest of the current systems and platforms began operation around this time. The past ten years of the 2010s have then seen the development of surveys, platforms, and system to measure entrepreneur ecosystems.
We do not think about what or how to measure our car’s performance when we drive. We have trust in what has become standardised indicators on a dashboard. I expect we will get to a similar position with entrepreneur ecosystems. The platforms, systems, and methodologies outlined below are all contributing to helping us get to that point.
Considerations and limitations of this report
As with any mapping process, there are several caveats to consider as you read through this report:
- Accuracy and completeness: The information is based on personal usage and observation. In some of the categories there is a representation of options rather than a complete list. There are a number of systems that perform market analysis based on company data and not all are listed. In other cases such as globally comparative surveys there are only a few in the market. In the example of government data, an audit of every nation’s approach to managing government data is beyond the scope of the research. This report is a first attempt at providing a framework of platforms. Corrections, clarifications, and additions are welcome.
- Category cross-over: The categories were chosen based on what is understood by the primary function of the platform. There can be cross over. A mapping system may use a survey to collect data, or a survey may make collected data available in a map. A regional mapping platform can present data in a business insights format or use map data to provide a ranking. Developing a taxonomy is not perfect, but there is transparency so people can make their own decisions.
- Audience: The primary audience for this post are government policy decision makers and academic researchers. It may also be of interest to entrepreneur supporters such as accelerators and innovation hubs. The general public could also benefit in understanding the background behind platforms and surveys in their region.
- Recommendations and critique: The report presents a brief overview of platforms. A critical review and recommendations are outside the scope of this report, with a few exceptions. First, business insight platforms have inherent challenges with data accuracy and completeness, compounded when data is shared between systems. Information from these systems should be used for indicative information about the business or sector and are not an accurate overall reflections of a region. Second, index and ranking approaches rely on transparent and consistent methodology and data accuracy. Ranking is meaningless and can do damage to a region’s brand if the method and data on which the ranking is based is not reliable. Third, survey methodology is important to understand when making assumptions about what the survey says. A survey that focuses on a specific population such as startups using a non-probability sample will not reflect size of the population and further should not be used for comparing regions.
- Declaration and acknowledgement: This report is based on my personal experience and is informed by my various roles. I am Director for the not-for-profit company Startup Status and much of the data here is based on creating the mapping research platform. I am also a Research Fellow at the Australian Centre for Entrepreneurship Research at QUT which is developing the LAB-ii integration platform and where I was also involved in the collection for the Global Entrepreneurship Monitor. I work with the Rural Economies Centre of Excellence with the University of Southern Queensland where I am completing my PhD on innovation ecosystems and community resilience. I am the Managing Director for Australia of the Global Entrepreneurship Network which partners with Startup Genome on their global reports. Finally, I am a signatory on the Startup Commons EcosystemOS common data platform with Startup Status to align data sets from various systems.
This post has been developed from my own research, and contributed to by the broad community in which I work. The aim is to identify where there might be gaps, how best to support the Australian and global economies, and how best to support those already doing great work. The research is shared publicly to accelerate this outcome.
A taxonomy of measurement systems
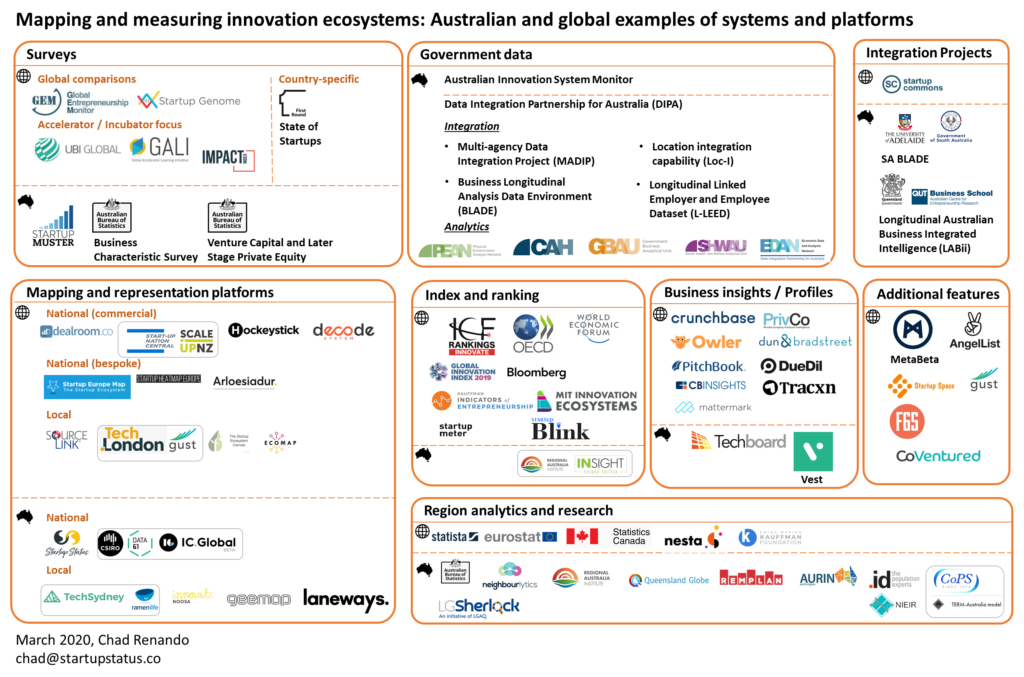
Approaches to measuring entrepreneur data can be grouped into broad categories based on the primary purpose:
- Surveys: collect and represent data from standardised surveys.
- Mapping and representation platforms: represent roles and actors in an ecosystem and their relationships with or relative position to each other.
- Government data: manage, collate, and make available data owned or managed by the government that has been submitted by individuals and businesses.
- Integration projects: integrate multiple data sources, including government data, for ease of further analysis.
- Index and ranking: compare populations or regions based on diverse data sets, including government, public, and survey data.
- Business insight / profiles: present organisation and individual profiles for promotion, analysis, and research.
- Additional features: provide functionality that results in additional data about the region’s entrepreneur activity.
- Region analytics and research: collate and present broad regional community and economic data.
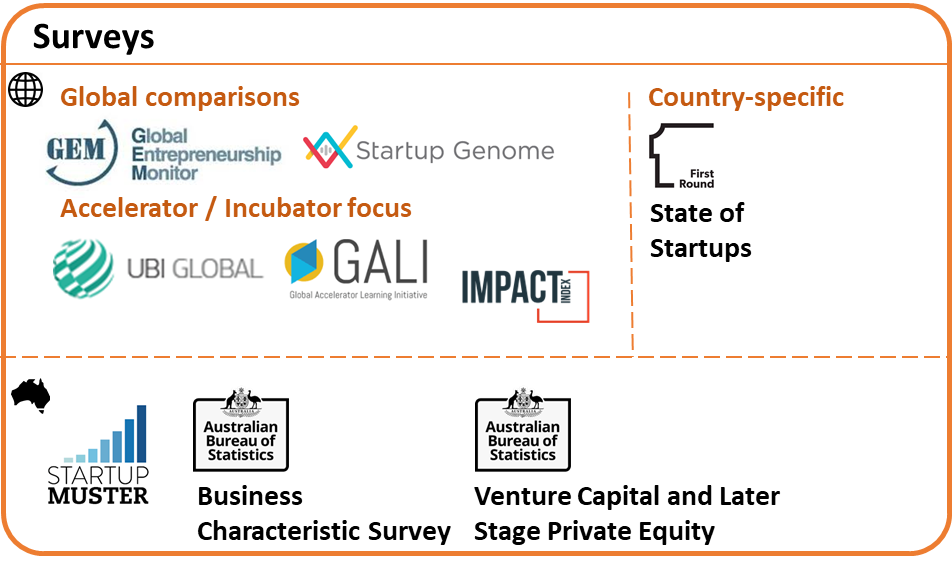
1.0 Surveys
Entrepreneur surveys can be the easiest way to access new data, but they can also be costly to manage and have accuracy challenges depending on how they are managed. There can also be survey fatigue if there are multiple surveys running at the same time asking similar questions from different platforms. Having an awareness of approaches and what is available can help make the process easier.
Difference in survey approaches
A main difference to consider in surveys is whether they are reflective of the total population, or they reflect the views of a specific segment of the population who completed the survey. The technical terms for the two approaches are probability (random) or non-probability (non-random) sampling.
Probability surveys are often delivered through randomised and geographically quota-based phone calls and online groups. An example is the Global Entrepreneurship Monitor, which in 2019 randomly called and emailed 10,000 people across Australia to gauge perspectives on entrepreneurship. A quota of responses was needed based on region, age, and gender to ensure the views of a representative sample of the nation was captured. The benefit is that we have a better understanding about what the national population thinks about entrepreneurship and insights from those who identify with entrepreneurial activity.
Non-probability surveys are often promoted and emailed to select groups, such as startup founders or entrepreneur in a specific region or industry. This is the case with Startup Muster or Startup Genome. The benefit of the approach is that it provides insights into what a segment of the population feels about a topic, such as startup founders about entrepreneur support in their region. The downside of the approach is that it will not necessarily be representative of the population and it can be biased by the sampling method and the organisation that promotes the survey.
1.1 Global Surveys – Global Entrepreneurship Monitor (GEM) and Startup Genome
There are two main surveys that compare global economies in terms of innovation: the Global Entrepreneurship Monitor (GEM) and Startup Genome.
Global Entrepreneurship Monitor (GEM)
The Global Entrepreneurship Monitor, or GEM, is a national survey that examines characteristics, motivations and ambitions of individuals starting businesses, as well as social attitudes towards entrepreneurship. The survey began in 1999 from a collaboration between Babson College (USA) and London Business School (UK). Because the survey is a representative sample across over 100 economies, the data is accessible, and it can be compared over a long period of time, it is used heavily for academic research and policy decisions to understand and compare perspectives from different population segments between economies.
GEM has been delivered in Australia since 2002. The 2018 GEM had a specific focus on Adelaide and is currently delivered out of the Australian Centre for Entrepreneur Research at QUT. In 2019, the GEM Australia sample increased to 10,000 respondents from across Australia.
Startup Genome
Startup Genome focuses on city-based startup activity, has been in operation since 2011, and currently provides reports on over 50 cities. The approach combines proprietary surveys with additional data sources including: Crunchbase; Dealroom; Orb Intelligence; PitchBook; GitHub; Meetup; Salaries data from Glassdoor, Salary.com, and Pay- Scale; Techboard; and other reports and research.
Startup Genome has provided reports in Australia since 2012 with profiles focusing on Sydney and Melbourne. The survey is currently supported in Melbourne by LaunchVic.
Comparison
Both GEM and Startup Genome have core questions which can be expanded on for a given region. Both gauge ability, aspiration, and attitude at the individual and organisational level as well as assess perspectives of the broader culture.
Two primary differences between the surveys is the sampling method and focus. GEM uses a probability sample to represent a national perspective on entrepreneurship and looks at all entrepreneurs including employee entrepreneurs as well as nascent or emerging entrepreneurs. GEM also examines the general populations attitudes about entrepreneurship.
Startup Genome uses non-probability sampling and focuses specifically on startups and ecosystem supporters in metro cities.
Both approaches can be supplemented with additional data and provide valuable insights when used in combination for a national and local perspective.
1.2 Accelerator / Incubator focus surveys
Global Accelerator Learning Initiative (GALI)
The Global Accelerator Learning Initiative (GALI) is a collaboration between the Aspen Network of Development Entrepreneurs (ANDE) and Emory University to report on accelerator performance around the world. The first report was released in 2016 examining 15 programs. The program is currently supported by Australian government and includes contribution from 115 ventures. Programs in Australia listed on the website as of 2019 include: H2 Ventures (NSW), iLab (Qld), Innovyz (SA), Melbourne Accelerator Program (VIC), Muru-D (NSW), Rocket Seeder (Vic), Slingshot (NSW), Spark* International (Vic), The Difference Incubator (Vic), and Incubate (NSW).
InBIA IMPACT Survey
The United States-based InBIA IMPACT Index survey has been developed and deployed to gather information from entrepreneurship centers and client companies for a 360-degree analysis of the impact that entrepreneurship centers have on small businesses. The IMPACT Index examines and compares both center and client experiences and data with the goal of improving center offerings and establishing best practices throughout the US.
UBI Global
UBI Global was founded in 2013 in Stockholm, Sweden to identify where all the innovation hubs are located worldwide and to learn and share what makes them successful. The reports and bench-marking tools are based on surveys from over 700 incubation programs in more than 70 countries.
1.3 Other country-specific surveys
Each country will have a number of surveys that attempt to understand innovation and entrepreneurial activity. Examples that we come across are outlined below:
First Round State of Startups
The State of Startups survey produced by investment company First Round has been going since 2015 and produces annual reports focused on the United States. The 2019 report included responses from 950 respondents, focusing on founders or employees. Categories of responses include: Trends; Fundraising and exits; Team building; Company building; Leadership; Work habits; Diversity, Inclusion and belonging; Individual demographics; and Company characteristics.
1.4 Other Australian survey approaches
Startup Muster
Startup Muster is a survey of the Australian startup community that provided reports on Australian startups from 2015 to 2018. The report was unique as a a national-level survey of startup activity. The last annual survey did was released in 2018 and is not actively promoted nationally.
ABS Business Characteristics Survey
The Australian Bureau of Statistics (ABS) Business Characteristics Survey (BCS) has been delivered by the ABS since 2004 and has a target sample of 14,000 respondents from employing businesses. The annual survey provides information about Australian employing business and incorporate focus areas such as the emphasis on ICT use in 2017-18.
The Comprehensive Australian Study of Entrepreneurial Emergence (CAUSEE)
The Comprehensive Australian Study of Entrepreneurial Emergence research project, or CAUSEE, is worth noting as a longitudinal research project that ran from 2007 to 2013. The project followed 625 emerging (but not yet operating when first contacted) business start-ups and another random sample of 559 newly established young firms (which traded and had positive cash-flow when first contacted). In addition, judgment samples of 100+ ‘higher-potential’ ventures in each category complemented the study. Founders of these ventures participated in five rounds of comprehensive interviewing about the ventures and their development. The CAUESEE data set is currently in the public domain, free for anyone to use.
Venture Capital and Later Stage Private Equity Survey
The Venture Capital and Later Stage Private Equity (VC&LSPE) Survey by the Australian Department of Industry, Innovation and Science has been conducted since 1999. The survey collects responses from all VC&LSPE funds. This does not include grants, incubators, or programs that may provide funding but do not provide significant equity investments. It also does not include individual angel investment. The sample size for 2019 was 246.
Information provided includes types, number of, and amounts of investments and exits, investment sources, value of assets, characteristics of invested company, and nature of follow-on investments.
2.0 Mapping and Representation
Entrepreneur ecosystems can be difficult to understand. Visual maps help make sense of what is an abstract concept and lets entrepreneurs know where to go for help. I consolidated a list of some examples in a review I posted in 2017.
A map is simply a visualisation of data based on a framework. Geography is one popular framework, but other frameworks such as stage of business support, category of services (spaces, programs, funding, etc) and industry sector emphasis are also used. It could be said that business insight platforms are a form of a map, and maps are a form of business insight platforms.
A challenge with any map is that the landscape is always changing. Static maps in particular are difficult to maintain due to changing categories, actors shifting roles, new actors entering as others leave. Further, static maps do not allow sharing or analysis of underlying data.
Digital platforms are easier to maintain, but still require constant updating to remain relevant. Some mapping platforms are adding functionality to expand their services to collect data through functionality rather than centralised manual entry.
Typical information displayed on mapping platforms include: Startups, Spaces, Incubators, Programs, Courses, Events, Jobs, News, and other resources.
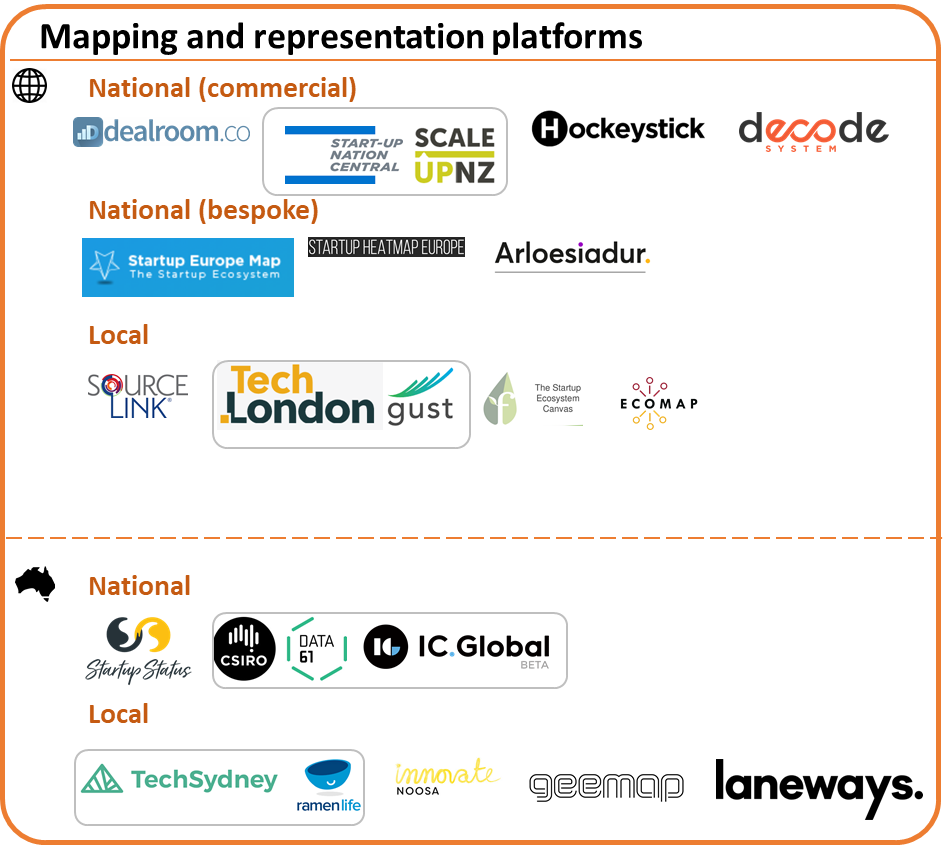
2.1 National commercial mapping platforms – Global
The larger the geography, the more challenging it is to represent and maintain the map. A few platforms offer their software for other countries to map their ecosystem. The customer base of those who would pay for a national maps is relatively small, usually the federal government, a national entrepreneur or innovation body, or a collaborative group made up of universities, industry, and government agencies. It is unlikely that a nation will have more than one national map due to duplication of entry and cannibalising scarce funds allocated towards ecosystem development work.
Dealroom
Dealroom, founded in 2013, provides white-label ecosystem maps at a national or local level. A local agency manages the platform and supports the data collection and curation.
They currently list 11 maps as listed, including: Netherland’s TechLeap and WeTech Rotterdam, Amsterdam’s Startup Amsterdam, Germany’s Be Berlin and Ground Alliance Ruhr, Portugal’s Scaleup Porto, France’s La French Tech, Lithuania’s Startup Lithuania, Rome’s Startup Roma, UK’s Tech Nation, Taiwan’s Tech Arena.
Startup Nation Central
Startup Nation provides white-label ecosystem maps at a national or local level. A local agency manages the platform and supports the data collection and curation. The platform is based in Israel and has additional installations in Taiwan and New Zealand. A local agency supports the data collection and curation – the federal government Callaghans Innovation in New Zealand and consultancy-backed Sphere8 in Thailand.
Hockeystick
The aptly named Canadian-based Hockeystick is unique in that data is updated through surveys via accelerator programs and innovation hubs. The platform is currently providing data for Canada and collaborating with InBIA for accelerator data, a partnership with Chile government, and the European Business Angel Network.
Decode System
Developed from Artesian Investment in Australia, Decode Systems provides a comprehensive map, company details, and ecosystem dashboards. Initially focused on Australian agriculture, the majority of the data is current outside of Australia. At the time of this post, 12,285 companies are listed on the platform, of which around 40% are listed as in Australia. The platform also lists 1,498 support organisations and 2509 investors globally, of which 273 investment organisations and 700 support organisations are in Australia.
2.2 National bespoke platforms – Global
Some national platforms are bespoke, or custom, to a region. It is unlikely that they will be developed commercially for other nations.
Startup Europe Map
The Startup Europe map provides a geographic map of actors in the European startup ecosystem. There appears to be little functionality beyond a geographic directory and it is difficult to determine if it is maintained as of 2019.
Startup Europe Heatmap
The Startup Heatmap Europe maps sentiment of founders to place, space, and programs. Annual reports are available from 2016. The 2019 report included 806 complete responses, of which 53% were founders. The project focuses on mobility and sentiments towards space and programs.
Arloesiadur
Arloesiadur, or “Innovation Directory” in Welsh, is a collaboration between Nesta and the Welsh Government to map innovation in Wales. Not a map per say, but it does provide interesting visualisation around network effects and trends.
2.3 Local maps – Global
Ecosystem maps based on a local state or city can be more detailed and easier to implement than an entire nation. That said, large metro cities can have a GDP, population, and complexity of a small nation. The platforms below allow local regions to map and analyse their key stakeholders.
SourceLink
Based in Kansas City, SourceLink (formerly Biz-Trakker) is a comprehensive client relationship management (CRM) system built specifically for entrepreneurial support organizations in support of startup, small growth-oriented businesses, and entrepreneurs. The approach also scales to the ecosystem level with SourceLink’s Entrepreneurship Ecosystem Reporting. Examples of solutions within their suite include the Resource Navigator (Iowa example) and print-based SourceFinder.
Gust / TechLondon
TechLondon is an online platform connecting and supporting London’s expanding entrepreneurship ecosystem. Built on IBM’s Bluemix platform as a service, the platform is a collaboration between Gust and other technology providers released in 2015 and integrates multiple data sources.
The Startup Ecosystem Canvas
The Startup Ecosystem Canvas by the Founder Institute provides a static map of support organisations based on stage and focus area. Completed maps allow for user input of the underlying Word document. The Canvas can act as a good starting point for regions wanting to get an initial map up, like a business model canvas for a region. Australian examples include Adelaide, South Australia (November 2019), Melbourne, Victoria (September 2019), and Sydney (February, 2019).
Ecomap
Ecomap was initial developed for Baltimore and is now offered for other regions. The format is a resource list filtered by actors and function.
2.4 National commercial platforms – Australia
A few approaches have emerged to represent and measure the Australian ecosystem.
Startup Status
Full disclosure, I am the director of the not for profit company Startup Status and the underlying mapping platform. The insights from the process has inspired much of my current research and projects.
The Startup Status mapping platform developed out of a research project to map and understand the Australian innovation ecosystem. The platform currently holds 2,313 “hubs” in the ecosystem allocated to 26 roles . There are over 14,000 organisations associated with the hubs as members or participants. The platform has functionality to survey organisations, provide each hub with a dashboard of member details, and an aggregate view.
Further sub-maps are produced on a regular basis, such as maps for the Creative industries, Female entrepreneurship, and Climate change.
IC Global (CSIRO, Daat61)
The InnovationMap is an initiative of CSIRO’s Innovation Catalyst Collaborative research Centre (CRC) project designed as “an interactive, geographic visualisation of innovation related data”. The map provides visualisation of data on the Cesium platform, with the intent to incorporate additional data sets over time.
2.5 Local maps – Australia
Local maps provide information at the local government or city level. The aim of the platforms is often to direct attention to support organisations for local companies as well as to increase the profile of the region to attract additional activity and investment. While some regions have PDF maps, the regions below have digital and interactive versions which presume some level of public data availability.
TechSydney / Ramenlife
The TechSydney site is built on the RamenLife platform. The site currently lists 2,790 people, 679 startups, 37 events, 13 programs, 58 jobs, 22 accelerators, 9 investors, and 11 coworking spaces.
Melbourne Laneways
Melbourne Laneways is a platform developed for LaunchVic, Victoria state government’s startup ecosystem support organisation. The laneways platform lists around 540 startups, 40 investors, 38 accelerators, and 159 workspaces, and 4 events.
Innovate Noosa
The Innovate Noosa website offers a directory and map of innovation support in Noosa, Queensland, as well as a playbook to help people find resources based on their needs.
Geemap
Geemap is the interactive entrepreneur ecosystem map for Geelong, Victoria.
3.0 Government data
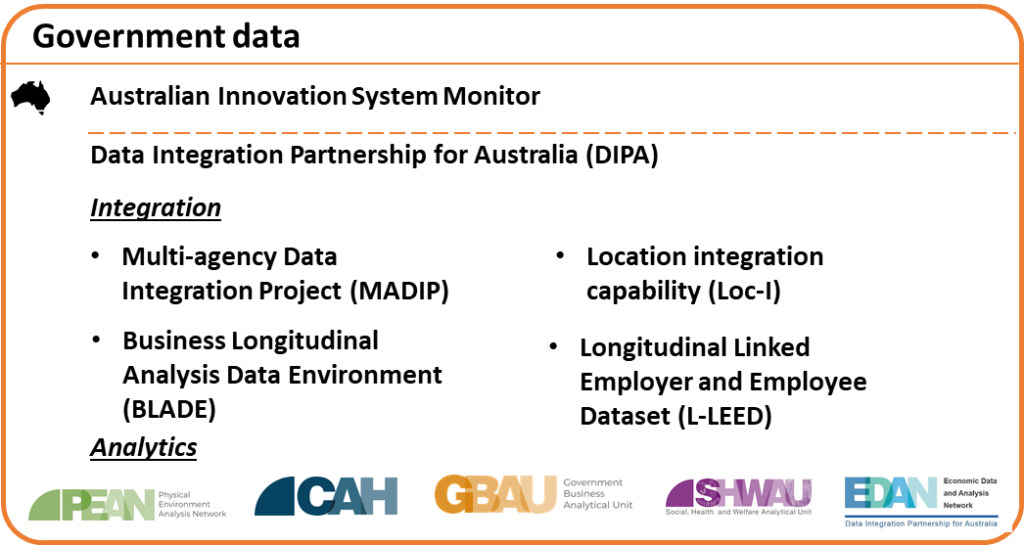
Government data includes any data owned by the government that is submitted by individuals or businesses through reporting, applications, and census. There are obvious sensitivities related to privacy and confidentiality, but these can be addressed through controlling access and aggregating, deidentifying, and anonymizing the data. Using the total population of registered businesses as a reference point provides a valuable tool for other market platforms.
Each region has various strategies for managing and providing access to economic data. National policies and platforms support state approaches when can then be leveraged by local government regions.
Only the Australian approach is examined, as a full audit of strategies by other countries is out of scope for this report. Approaches such as the European Innovation Scoreboard are worth noting.
Australian Innovation System Monitor
The Australian Innovation System Monitor is an interactive online report that integrates a range of data sets, including from the Australian Bureau of Statistics, the Global Entrepreneurship Monitor, the OECD. From 2010 to 2017, the Australian government produced annual PDF reports on the Innovation System. In 2019, the Minitor was released and is periodically updated with new data sets to provide more of a real-time view on Australia’s innovation system.
Data Integration Partnership for Australia (DIPA)
The Data Integration Partnership for Australia program is a strategic and focused approach to data by the Australian federal government. The cross-agency initiative started in 2017 and involves over 20 government agencies in the three-year, $130.8 million program to “maximise the use and value of the Government’s data assets.” The program is building or supporting a series of data assets from different areas of health, education, finance, social services, and intelligence. These data assets leverage a suite of tools to integrate multiple data sets, including the Multi-agency Data Integration Project (MADIP), Business Longitudinal Analytical Data Environment (BLADE), a Longitudinal Linked Employer and Employee Dataset (L-LEED), and a Location Index (Loc-I).
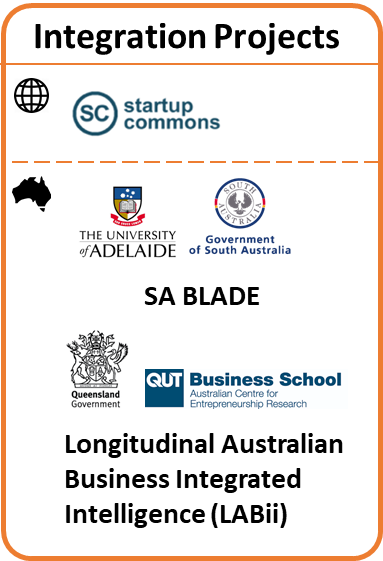
4.0 Integration projects
The primary function of integration projects is to act as intermediaries connecting different data sets. This is particularly valuable when connecting to government data which often has restrictions on who can access the data and for what purpose.
A global scan of integration projects is beyond the scope of this report, but Startup Commons pursuit of an open data framework is of note. In Australia, there are many projects integrating with government data. Two projects in particular, SA Blade and LABii, are focused on providing interface capabilities for external data sets and platforms.
4.1 Global integration projects
Startup Commons
Startup Commons is developing an integration platform for systems that focus on startup business creation, managing support services for startups or managing & coordinating ecosystem development, for sharing and distributing applications between ecosystems around the world. The EcosystemOS platform offers common user accounts and API’s with documentation for user data portability, API connections, data models and data sharing principles to develop applications for startup ecosystems. It also includes a marketplace for connected ecosystem applications and third party API functions.
4.2 Australian integration projects
Two known projects are the Longitudinal Australian Business Integrated Intelligence (LABii) system managed out of the Australian Centre for Entrepreneurship Research with QUT and the SA BLADE system managed out of the Entrepreneurship Commercialisation and Innovation Centre with the University of Adelaide. In development from 2017, the systems integrate government data through the BLADE platform with external platforms and data sets. The outcome is entrepreneur performance and quality data reporting and contributing factors from the entrepreneur, region, industry, and the ecosystem overall.
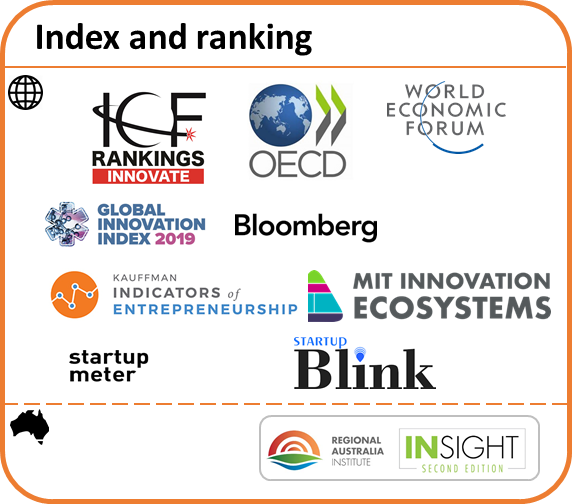
5.0 Index and Ranking
Accurate and meaningful comparisons can provide helpful feedback. Index and ranking methods use various indicators to compare regions and economies. These can be similar to surveys such as Startup Genome and GEM, but with less emphasis on a custom survey and rather correlate multiple country-wide data sources.
Reliability of the underlying data, transparency of the process, and consistency over time are critical to have any confidence in the rankings. If the dimensions change simply because a country subscribes to the service or the data collection is inconsistent, the ranking can be damaging is used for policy or business decisions.
Intelligent Community Foundation (ICF)
The Intelligent Community Forum (ICF) provides the annual Intelligent Community Awards which ranks cities based on factors that determine a community’s competitiveness in the digital economy. Three economic growth factors include Connect, Work, and Innovate. Three social and cultural growth factors include Sustain, Include, and Engage. In 2019, Melbourne, Victoria ranked at number 3, Sunshine Coast, Queensland ranked at number 7, Ipswich, Queensland ranked at number 14 on the global innovation ranking.
OECD innovation indicators
The Organisation for Economic Co-operation and Development (OECD) brings together the 37 member countries and a range of partners to collaborate on key global issues at national, regional and local levels. Innovation is a key part of this work. Examples of rankings include:
- the Science, technology and Industry Scorecard (Australia’s 2017 scorecard),
- Innovation and technology data sets (Australia’s data sets),
- Business innovation statistics and indicators, and
- Measuring tax support for innovation.
World Economic Forum Global Competitive Index
The World Economic Forum is the International Organization for Public-Private Cooperation. The WEF Global Competitive Index ranks 141 economies (Australia is 16 in 2019) using a framework of 12 pillars across four dimensions of Enabling environment, Human capital, Markets, and Innovation ecosystem.
Global Innovation Index
The Global Innovation Index examines 80 metrics for 129 economies to examine multidimensional facets of innovation-driven growth. Australia listed at number 22 in the 2019 overall innovation rankings.
Bloomburg Innovation index
The Bloomurg Innovation index examines data from over 200 economies, selecting data from 105 that have available data. Metrics include R&D Intensity, Manufacturing value-added, Productivity, High-tech density, Tertiary efficiency, Researcher concentration, and Patent activity. Australia ranked at 20 for the 2020 report.
Kauffman Foundation’s Indicators of Entrepreneurship
The Kauffman Foundation’s Indicators of Entrepreneurship evolved from the previous Kauffman Index of Entrepreneurship and offers in-depth measures, reports, and accompanying interactive data visualizations that present entrepreneurial trends in the United States. Data is based on government census survey data and provides cross-state comparison on the rate of new entrepreneurs, the opportunity share of entrepreneurs, startup early job creation, and startup early survival rate.
MIT Innovation Ecosystems
The MIT Innovation Ecosystems framework is an initiative out of MIT and the MIT Regional Entrepreneurship Acceleration Program (REAP). The platform provides cross-country graphs of entrepreneur and innovation capability across five categories of Culture and incentives, Demand, Funding, Human capital, and infrastructure.
Startup Meter
Startup Meter produces a Startup Friendliness Index for each region based on a comprehensive analysis of startup ecosystems at the city-level carried out using an indicator-based framework. The index contains over 80 indicators that are categorized in 14 sub-domains and 6 domains, with the domains representing the key aspects of an ecosystem, for instance access to finance or human capital potential. The initial analysis was performed on seven cities from Africa and the Middle East make up the first edition of the q- Accra, Amman, Beirut, Cairo, Nairobi, Rabat, and Tunis. The last blog and twitter posts were from 2018 and the Facebook page is down, so unsure of the platform is still maintained.
Startup Blink
Startup Blink displays a global ranking of ecosystems, with data provided by local partners and web mining. The project is evolving and ambitious, but there remains some ambiguity about the ranking. For example, Brisbane, Queensland is ranked at position 87 and has increased 31 positions from 2017 to 2019. Variances are expected given the scope of a global mapping project operating since 2017. It will be good to see greater reliability in the underlying method to allow for improved decision making as the data set grows and algorithms expand.
Regional Australia Institute INsight
The Regional Australia Institute INsight is an online interactive map of Regional Competitiveness in Australia. The platform uses 71 indicators in 10 themes to provide a snapshot of the competitive position of 599 regions using census data.
6.0 Business insights / Profiles
Business insights and profiles platforms display business information and provide a level of analysis. The number of platforms listed are indicative, as the field of market research platforms has been available for some time before the global emphasis on startups.
The business model for most of the platforms is based on collecting and selling data and analysis. Data is collected through automation and manual entry from web scraping, data mining, and system integration. The value of the system is dependent on how well the systems maintain data accuracy and completeness. The field can be competitive and as platforms have shifted focus over time, as some add CRM functionality and others acting as investor deal flow funnels.
Company profile platforms are inherently challenged to maintain accurate data due to data such as private funding not being available and the challenge of manual updating. The accuracy is improved the higher profile the region or more dense the ecosystem. When I conducted a review in 2017 of 8,000 records in Australia, there was a 20% error rate in company location or status. This is expected given the rapid pace of change and manual and remote nature of data maintenance.
This present a challenge when platforms share data that is incorrect and that data is used to compare regions. I often conduct a test with a few mid-sized Australian companies and there can be identical inconsistencies between platforms such as Owler and Crunchbase. Funding rounds, key roles, and headquarter locations can be missed or inaccurate over several years. CB Insights, which lists a smaller number of companies and appears to be more heavily curated, does not appear to have as many inconsistencies but still does not always reflect actual transactions.
6.1 Global Business insights / Profiles
Crunchbase
Starting in 2007, Crunchbase is one of the most well known and accessed platforms. They platform currently lists over 55 million active users, 1.3 billion API calls, and 3.9 billion updates each year. There are currently 14,759 companies and 1,490 investors listed as being located in Australia as of March 2020.
These companies are not all technology companies, including many service based companies such as Jacks Antiques or Curry Delights as well as major corporations such as Qantas and Comm Bank. The search function is detailed, however, allowing self-management of the cleaning process.
A main feature of Crunchbase is the API integration, allowing third-party platforms to access data, with examples including Startup Genome and StartupBlink. As mentioned, the value of the integration is to correlate company data rather than contribute to ranking given the likelihood for inaccurate data.
CB Insights
CB Insights is a data research analytics platform that integrates with multiple data sets. Subscribers can conduct their own research and access data-driven trend analysis. They are well known for their frequent analysis and infographs.
The platform currently lists 6,689 companies, 6,464 deals, and 1,611 investors in Australia
Owler
Owler allows tracking and analysis of company profiles, including seeing in-depth company details such as competition and alternatives, history, press releases and more. The platform states there are over 13 million company profiles, 40 million relationships, and 500,000 monthly data contributions. Around 109,052 companies are listed in Australia.
Pitchbook
Pitchbook is a financial data and software company that provides market data for deal flow. Pitchbook was founded in 2007 and acquired by independent research company Morningstar in 2016.
Mattermark
Mattermark is a data analytics platform that started in 2012, was acquired by CRM company Full Contact and shut down in 2017, and relaunched as an independent company in 2019. At the time of this writing, there were 4,308,907 companies in the system, with 53,880 listed in Australia.
dun&bradstreet
dun & bradstreet is one of the oldest analytics companies, with origins going back to 1841. The director shows companies that have a D-U-N-S number, of which there are 57,543 listed in Australia. While the results are relevant for analysis at a system level, the director will not be as relevant for managing emerging firms in Australia.
DueDil
London-based DueDil was founded in 2011 and states to report on data for over 50 million companies.
Traxn
Traxn provides company data and lists 963,555 companies. The filtered list for Australia shows 28,118 listings. This includes technology companies such as Canva, large corporations such as Comm Bank, and smaller IT service providers.
6.2 Australian Business insights / Profiles
The revenue required to maintain data platforms, the large amounts of data required, and the global nature of the companies, individual, and investment means that Australian-specific data platforms will be challenged. Various directories have come and gone over the years. The one area where an Australian approach can differentiate is through accuracy and coverage of the Australian early-stage market that is often overlooked by larger international systems.
Techboard
Techboard focuses on “Aussie Startup and Tech data” to provide a directory of startups and investment data for Australian startups. Originated and based out of Perth, the platform operates based on a manual capture of data across Australia. The platform has provided a directory of startups and emphasis on Australian startup investment reports from 2017. The site indicates there are over 3,000 company profiles listed.
Vest
Vest leans towards the promotional side rather than the data analytics side. A side project of Brisbane-agency JM developed in 2016, it is not clear as to the currency of the data but it does provide a good aesthetic experience.
7.0 Additional functionality
The Additional functionality category includes platforms that provide functionality and data is made available as a result of that functionality. This is distinct from other platforms where the sole purpose of the platform is to provide the data, and functionality such as deal flow connections and market research is a result of that data. Data is not necessarily accessible through the platforms, but they could be a means to access information about early stage activity if the permissions and integration was defined.
7.1 Global additional functionality platforms
MetaBeta
MetaBeta is a management platform for accelerators and incubators to track dealflow, provide metrics and reports, and manage mentor engagement.
AngelList
AngelList shares similar functionality to other profile platforms with additional functions for jobs, investment, and the validation platform Product Hunt. The platform lists 5,073,746 companies at the time of this writing, 10,575 located in Australia.
Startup Space
Startup Space is an app for building local communities, scheduling events, and managing mentoring and networks.
Gust
Gust focuses on investment,providing deal management tools for angels and helps startups through the business creation process. Through these features the website indicates there are over 800,000 founders and 85,000 investment professionals in the system.
Microtracker
An initiative of the Aspen Institute, Microtracker is a set of data tools and services that allow microenterprise development organisations to self-assess and improve. MicroTracker also provides stakeholders with data about the size, scale, and value of the US microenterprise industry. The platform displays data for 72 microenterprise development organisations in the US from FY2016 as of March 2018, and data for 852 clients of those programs for 2015.
F6S
f6s supports the application process for hackathons and accelerators, lists jobs, and provides other benefits to founders such as credits and discounts. At the time of this writing the site listed 17 programs in Australia, many of them no longer available.
Funderbeam
Founded in 2013, Funderbeam connects investors with companies to be funded.
Coventured
Coventured engages with corporates to get challenges addressed and scaleups to address those challenges. Originating in Australia, the platform has since expanded globally covering 97 countries and over 300 accelerators, co-working spaces, incubators, VCs, Corporate VCs, and industry associations.
8.0 Region analytics and research
The final category acknowledges additional data platforms focused on regional data or broad market analysis beyond the focus on entrepreneurs and high growth firms. A detailed review of these platforms will not be done for brevity and there are likely several not included. A sample list with links is provided below.
8.1 Global
- Statista: Insights and facts across 600 industries and 50+ countries
- Eurostat: the statistical office of the European Union situated in Luxembourg
- Statistics Canada: the national statistical office of Canada
- Nesta: innovation foundation in the UK
- Ewing Marion Kauffman Foundation: Entrepreneur foundation in the US
8.2 Australia
- Australian Bureau of Statistics: Australia’s national statistical agency
- Neighbourlytics: global urban tech company drawing on public social data to capture the ‘digital footprint’ of cities
- Regional Australia Institute: Research and advocacy body for regional Australia
- Queensland Globe: an online interactive experience to view Queensland’s location based information
- Australian Urban Research Infrastructure Network (AURIN): A collaborative network of leading researchers and data providers across the academic, government, and commercial sectors, providing a a one-stop online Workbench with access to thousands of multi-disciplinary datasets, from hundreds of data sources and analytical tools covering spatial and statistical modelling, planning and visualisation.
- economy.id: Provides local demographic and economic data, population forecasts and interactive demographic maps for detailed local area profiles, which are then made available to the public as a shared resource for the community.
- CoPS TERM Australia: TERM (The Enormous Regional Model) is a “bottom-up” CGE model which treats each region as a separate economy.
- Remplan: Economic and demographic data to support evidence-based decision making.
- LG Sherlock: a data storage and analysis tool using local government data.
9.0 Other mapping tools
Finally, there are other mapping tools often used to represent ecosystem data. These include:
Limitations, recommendations, and next steps
This report is limited in that it is necessarily brief as an initial version. Further research can provide greater individual analysis on platforms, provide a critical comparison, provide case study analysis on systems used in regions, and expand to a greater number of regions and platforms. The aim of this body of work is to provide an initial categorisation of around 65 systems that support understanding entrepreneurial activities in regions.
Each of the systems, platforms, and methods outlined are working to address a complex challenge. They are making the unknown known. They are addressing a complex challenge through simple and accessible feedback. No single solution can do everything but a region can consider a portfolio approach to understanding their entrepreneurial ecosystems.
Nations can consider supporting both the Global Entrepreneurship Monitor for total population views on entrepreneurship as well as Startup Genome for specific startup populations. Different mapping solutions can meet their needs, such as Hockeystick, Dealroom, Startup Nation Central, Decode Systems, Startup Status, or Sourcelink. Feedback from index rankings can be valuable, so long as there is an understanding of the underlying metrics involved. Leveraging local analytics platforms can be valuable using both privately collected and government data.
The recommendation is not to have one system or approach do everything, but to have a strategic approach to managing and collecting data. This requires central integration and investment. This return on this investment is more accurate and reliable feedback for more effective and efficient decision making.
Feedback, corrections, and collaborations are always welcome. I acknowledge that this post is for a niche audience. There is also much that can be added from personal stiries of those on the ground using systems and platforms.
If you are supporting the field of entrepreneur-related economic and community development and would like to know more or discuss the report, reach out to me through LinkedIn or at Startup Status or the Australian Centre for Entrepreneurship research at QUT.